Redlined Then, Rescued Now: How a 1930s Map Still Designs Michigan's School Budgets
- Rajah Smart

- 14 hours ago
- 3 min read
Announcing the release of TNEFP's newest research brief from the Spatial Echo Laboratory.
Somewhere in a federal archive sits a map of Michigan drawn before the Second World War. On it, surveyors for the Home Owners' Loan Corporation colored neighborhoods green for "best" and red for "hazardous." The red almost always fell where Black families lived.
We were told those maps were retired decades ago. Our newest research says they are still on the job — not as a faded stain on history, but as a working blueprint that quietly tells Michigan school districts how much money they get to keep.
Today, the Spatial Echo Laboratory at Tennessee Educational Funding and Policy (TNEFP) releases The Spatial Echo of Inequity: How 1930s HOLC Grading Designed Contemporary School-District Fiscal Outcomes Across Michigan Metropolitan Areas.
The idea: not residue, but design
Most conversations about redlining treat it as something that happened. Our framework — the Spatial Echo — treats it as something that is still happening, executed through the most ordinary machinery imaginable: the way schools are funded.
Picture it as a sender and a receiver. A redlined urban core keeps losing fiscal capacity; an insulated suburb keeps gaining it. Nobody in the system has to be discriminatory for this to work. Four facially neutral mechanisms — historical patterning, displacement pressure, jurisdictional hoarding, and policy erasure — carry the 1930s grading forward into today's budgets. The map drew the lines; the funding formula keeps coloring inside them.
To test it, we measured redlining exposure directly — overlaying the original HOLC maps onto the boundaries of school districts across eight Michigan metro counties — instead of guessing. Then we asked three questions and let the data answer honestly, even where the answer was modest.

What we found
1. Redlined districts hold weaker tax bases. Where the old "hazardous" grade covered more ground, the property wealth backing each student today runs lower. The effect is real if measurement-sensitive — the structural footprint of the map, visible in the ledger.
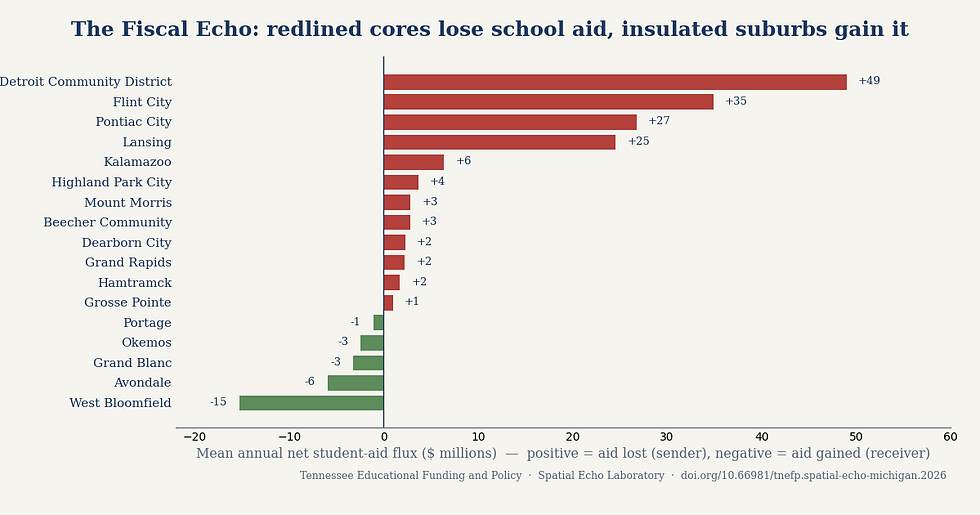
2. The money flows uphill — out of the cores, into the suburbs. This is the cleanest finding. Through interdistrict student-aid transfers, the most redlined cores are the biggest net losers of school dollars, while affluent, never-redlined suburbs are the net gainers. Detroit, Flint, Pontiac, and Lansing export tens of millions a year in net student aid; West Bloomfield, Avondale, and their peers take it in. The neighborhoods graded "hazardous" in the 1930s now subsidize the ones graded "best."
3. Distress follows racialized space — not the city limits sign. When you measure fiscal distress honestly — as the documented history of needing the state to step in — redlining exposure predicts it strongly. The districts the state had to rescue through deficit plans, emergency managers, tax capture, or outright dissolution are overwhelmingly the redlined, majority-Black ones.
And here is the part that a year-end balance sheet will never tell you: many of those rescued districts look "healthy" today. Their balances are positive. But a positive balance built by a bond, a consent agreement, or an emergency manager is not health — it is evidence that the district's own tax base could never carry it. The rescue is the proof of the wound.
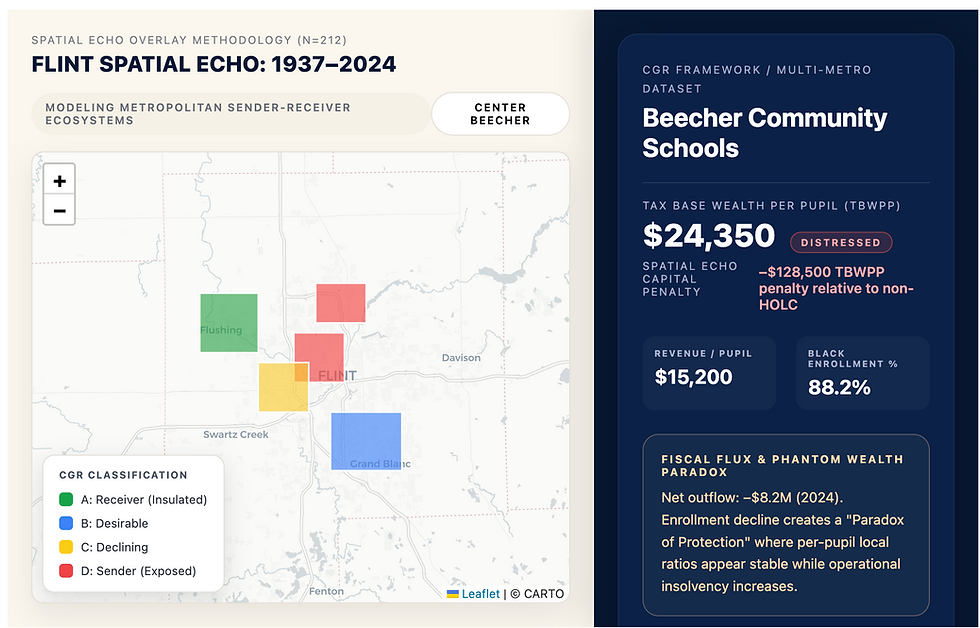
Beecher — a small, majority-Black district carved from Flint's redlined edge — behaves fiscally like the core it adjoins, while affluent suburbs the same distance out stay insulated. Flint cleared its operating deficit in 2016, but only through borrowed money, and remains bound to state oversight into the 2030s. Highland Park's school district survives in name only, kept alive to route property taxes toward old debt while a charter teaches its children. These are not accidents. They are the echo, still sounding.
Why it matters for policy
If distress tracks racialized space rather than municipal labels, then remedies aimed at the label will keep missing. A funding formula that lets per-pupil dollars drain out of redlined cores, and an oversight system that stamps a rescued district "healthy," don't just fail to fix the Echo — they perform it. Interrupting it means indexing help to historical exposure and to the documented history of intervention, not to this year's fund balance or to which side of a boundary line a child happens to live on.
Read the brief
The full brief — with the maps, the methods, the tables, and the verified district histories — is available now on our site.
Citation: Smart, R. E. (2026). The spatial echo of inequity: How 1930s HOLC grading designed contemporary school-district fiscal outcomes across Michigan metropolitan areas [Research brief]. Tennessee Educational Funding and Policy. https://doi.org/10.66981/tnefp.spatial-echo-michigan.2026
This work applies and extends the Spatial Echo framework (Smart, 2026a, Journal of Spatial Equity and Education) and builds on Michigan-specific findings presented at the Association for Education Finance and Policy (Smart, 2026b).
Comments